Once set up, sensors immediately start producing data that you can analyze.
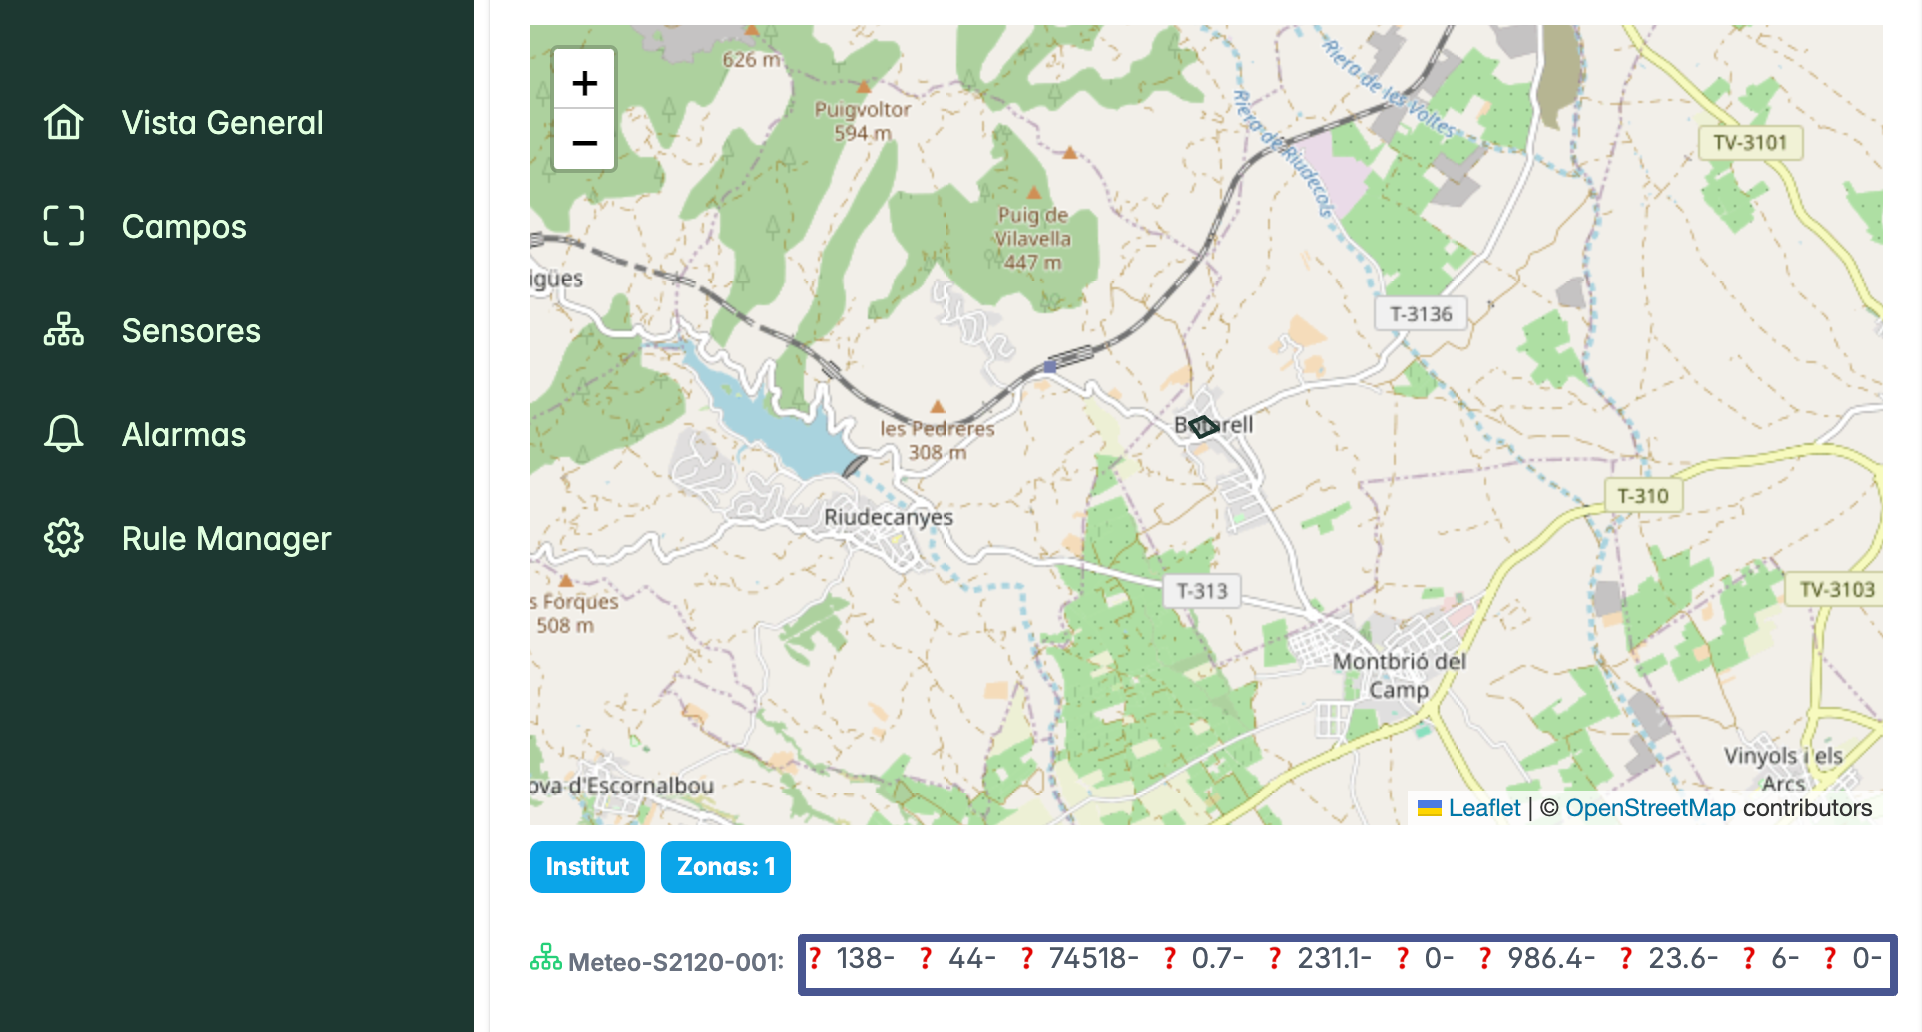
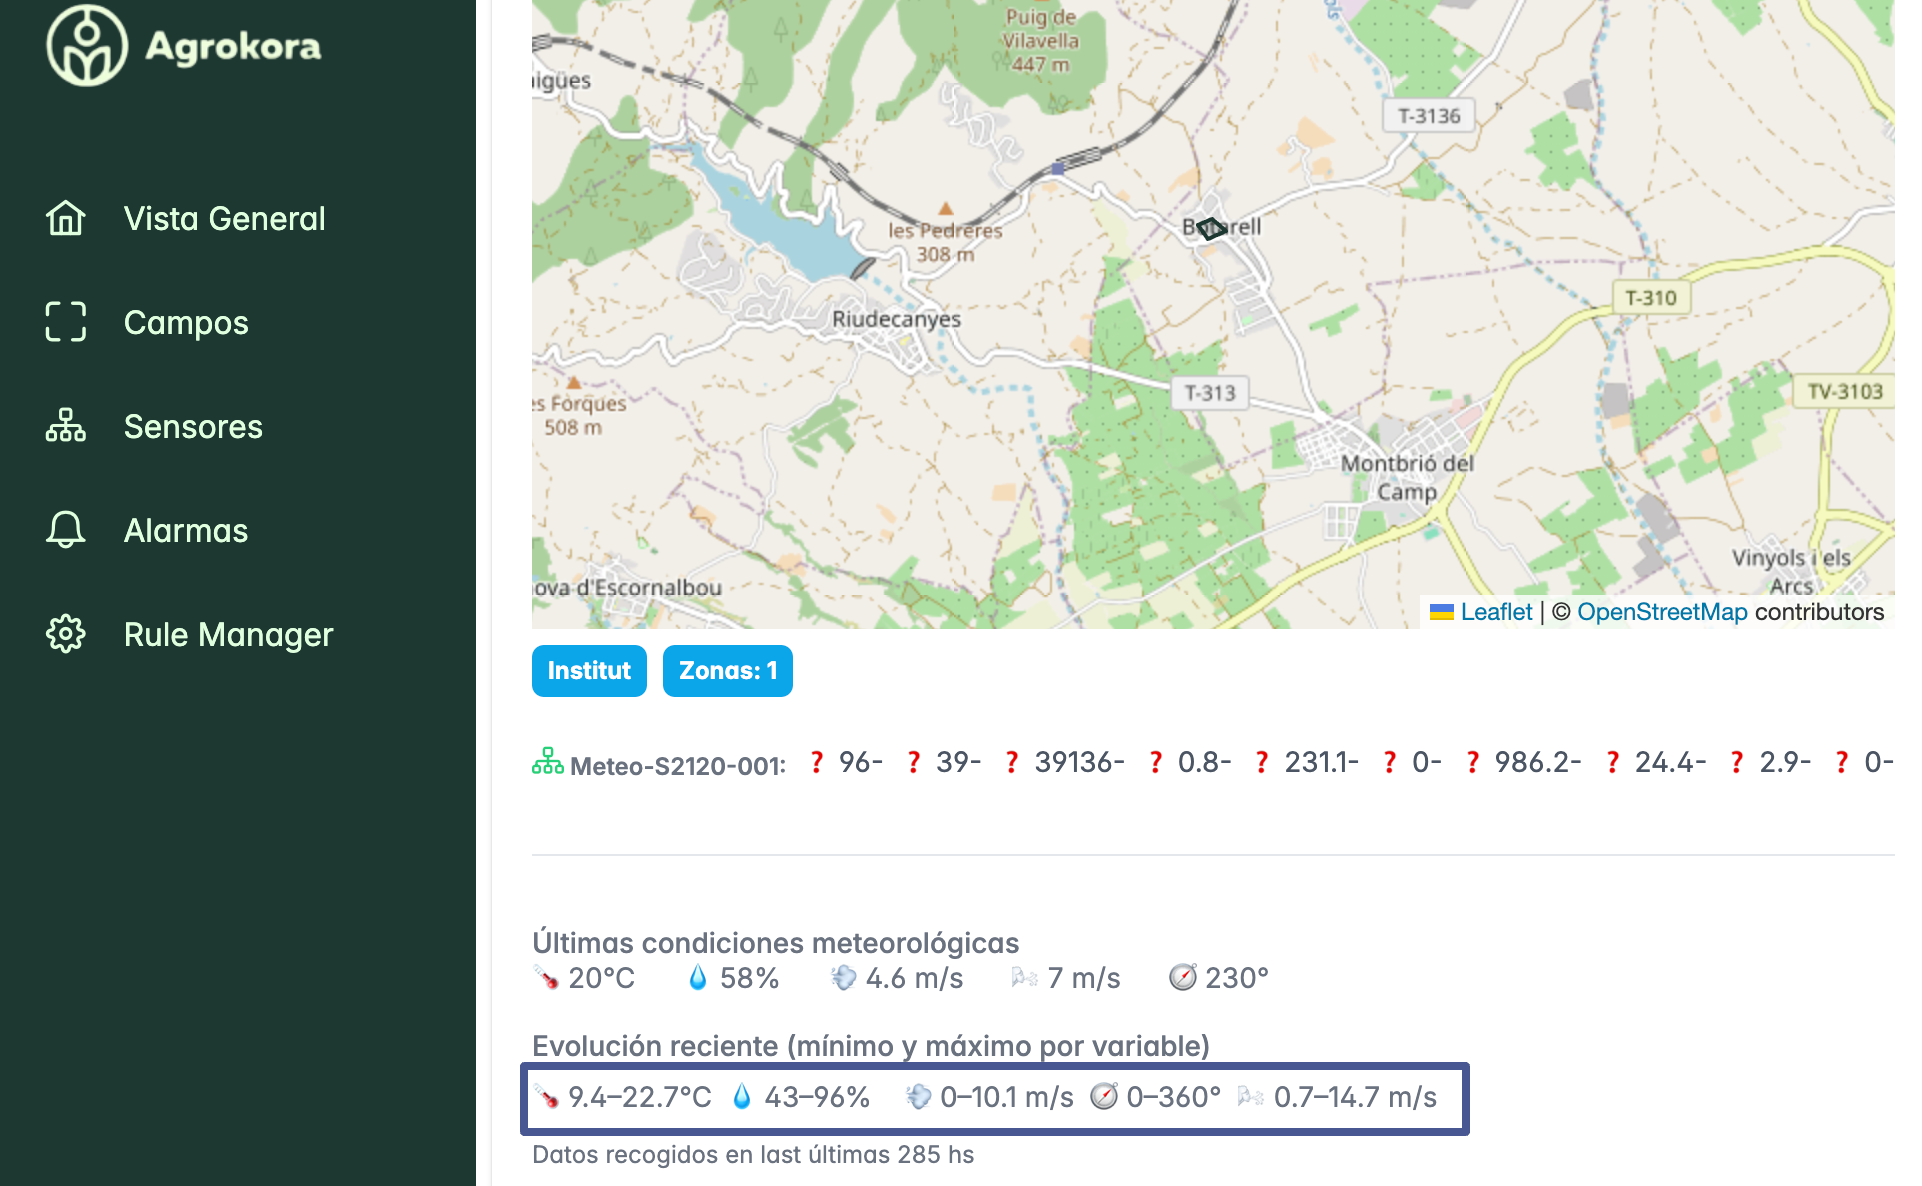
  • Use data summary to get the latest sensor readings. The readings correspond to the information provided by sensors for a specific patch. Vista General Pn
In this case the agricultural data provide readings on wind direction (138°), humidity (44%), light intensity (74518 lux), air velocity (0.7), accumulated precipitation (231.1), current precipitation (0), pressure (986.4), temperature (23.6°C), and UV indexes.
  • View the min / maximum values over time Data Time Pn
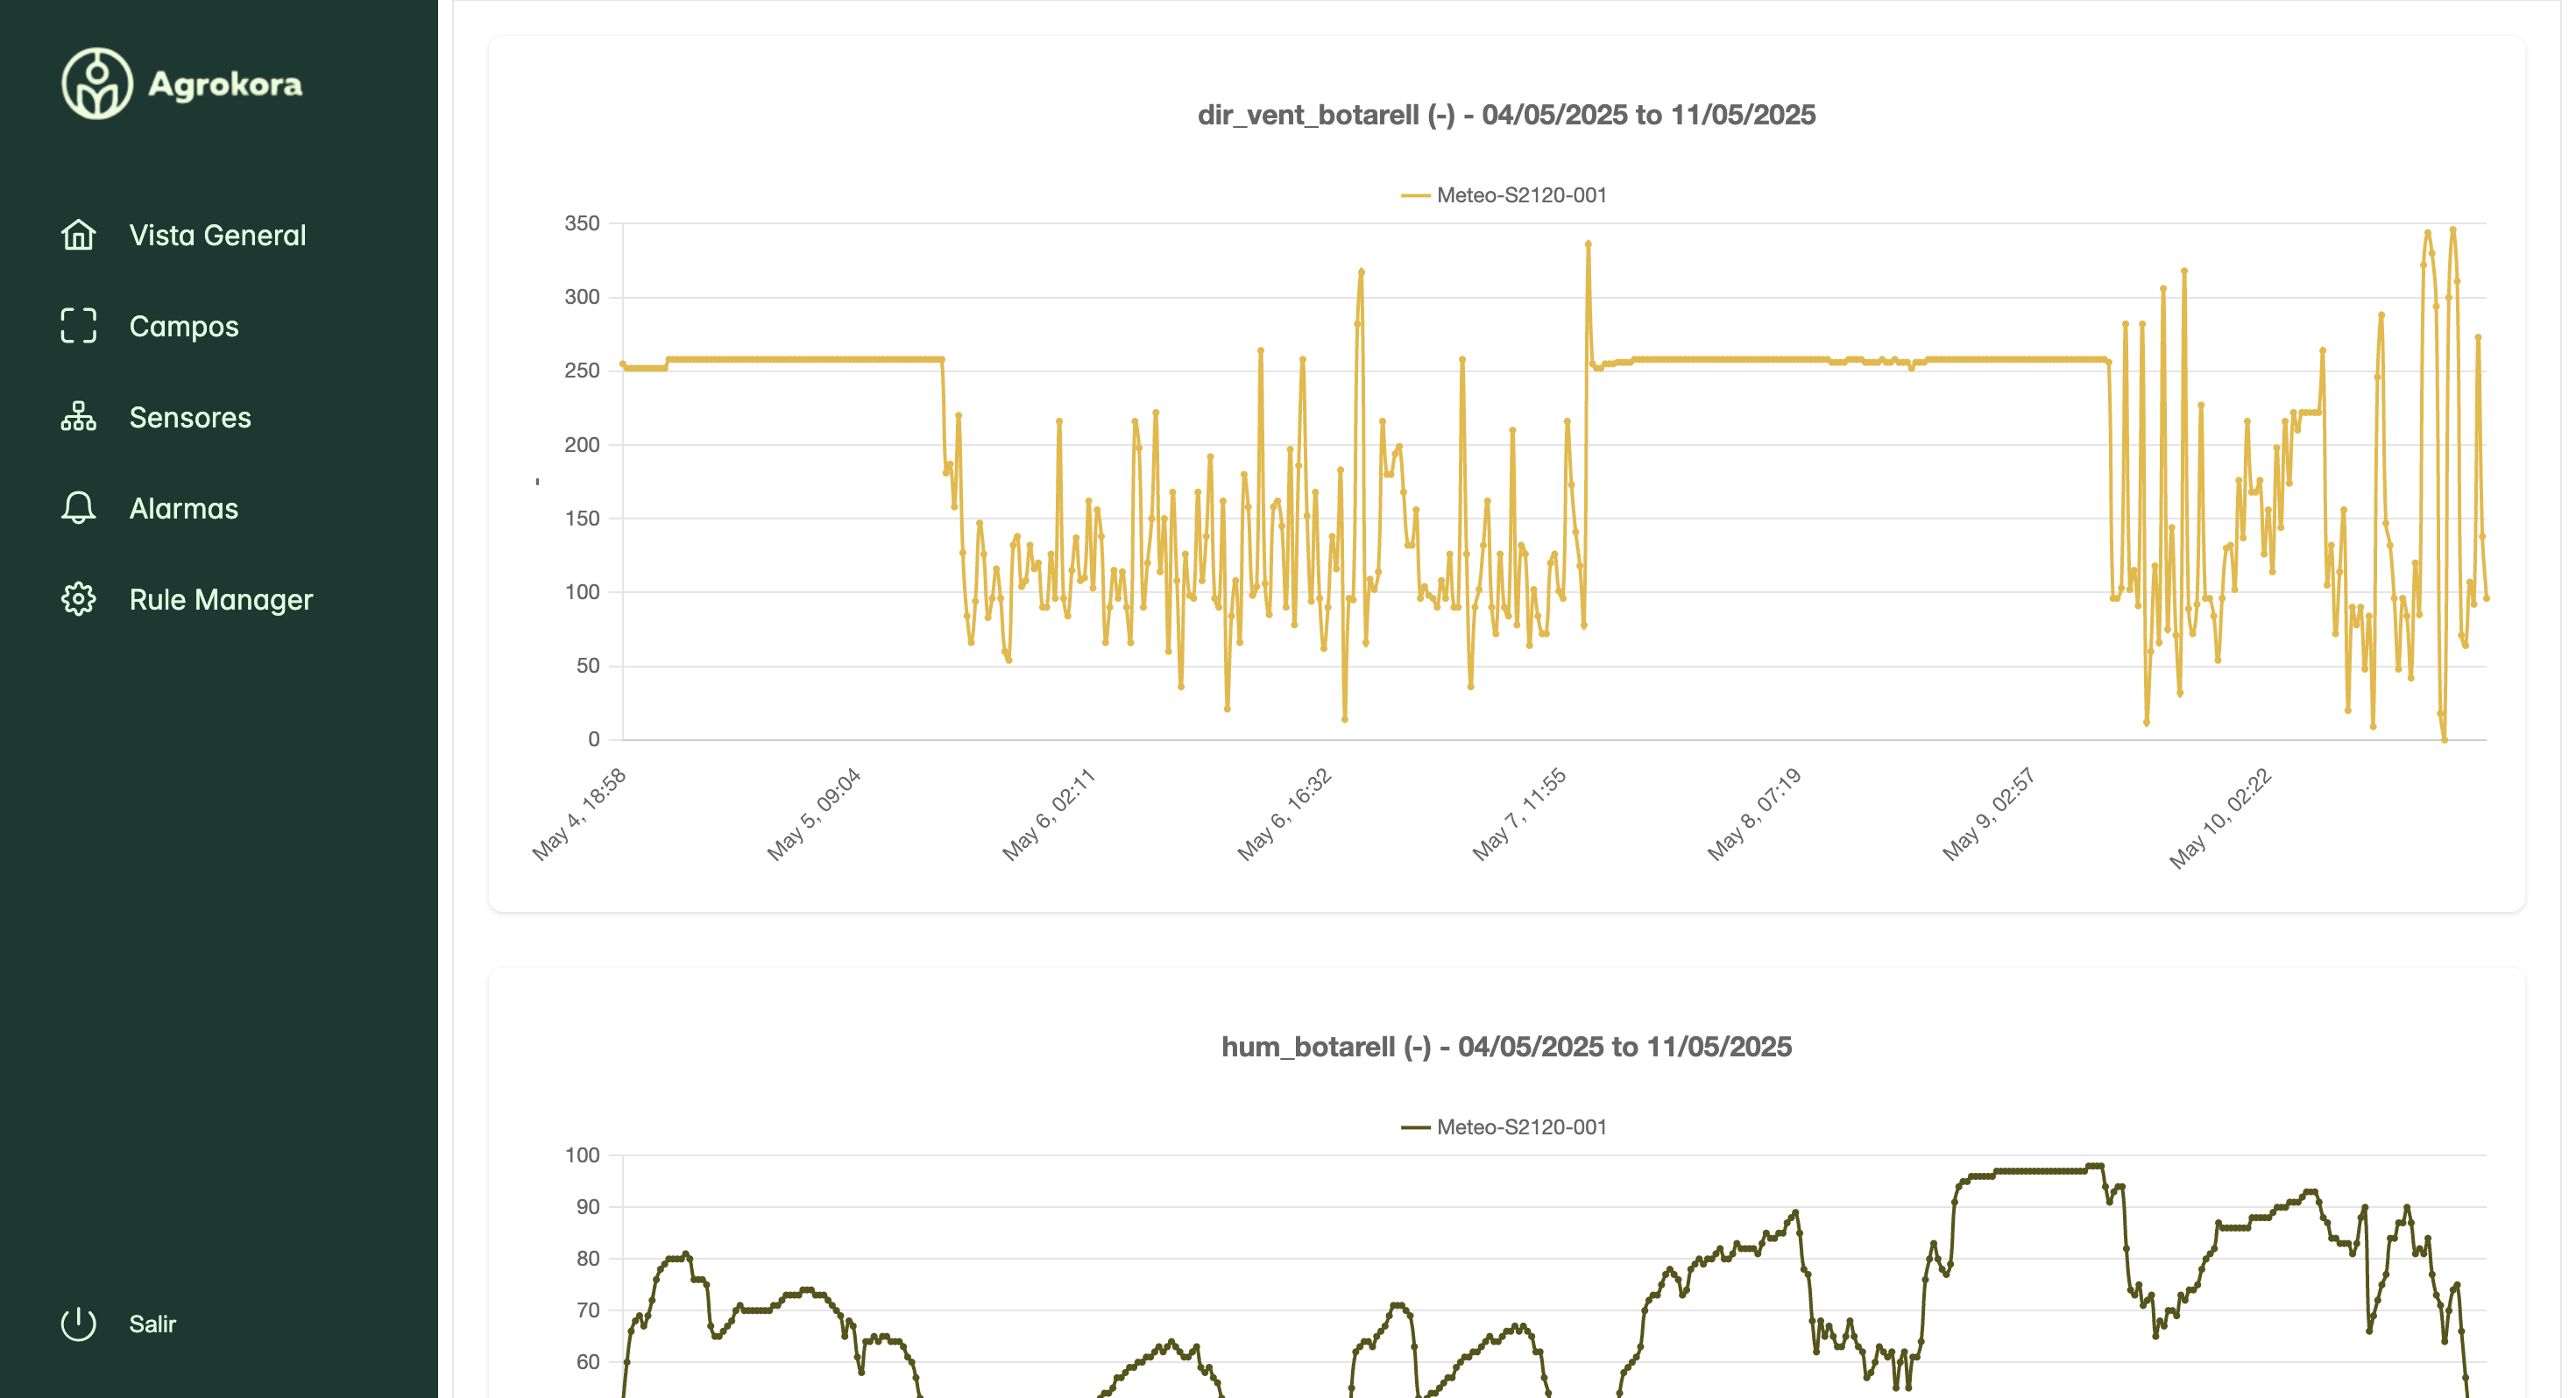
  • View specific measurements for a set time period Graph Pn
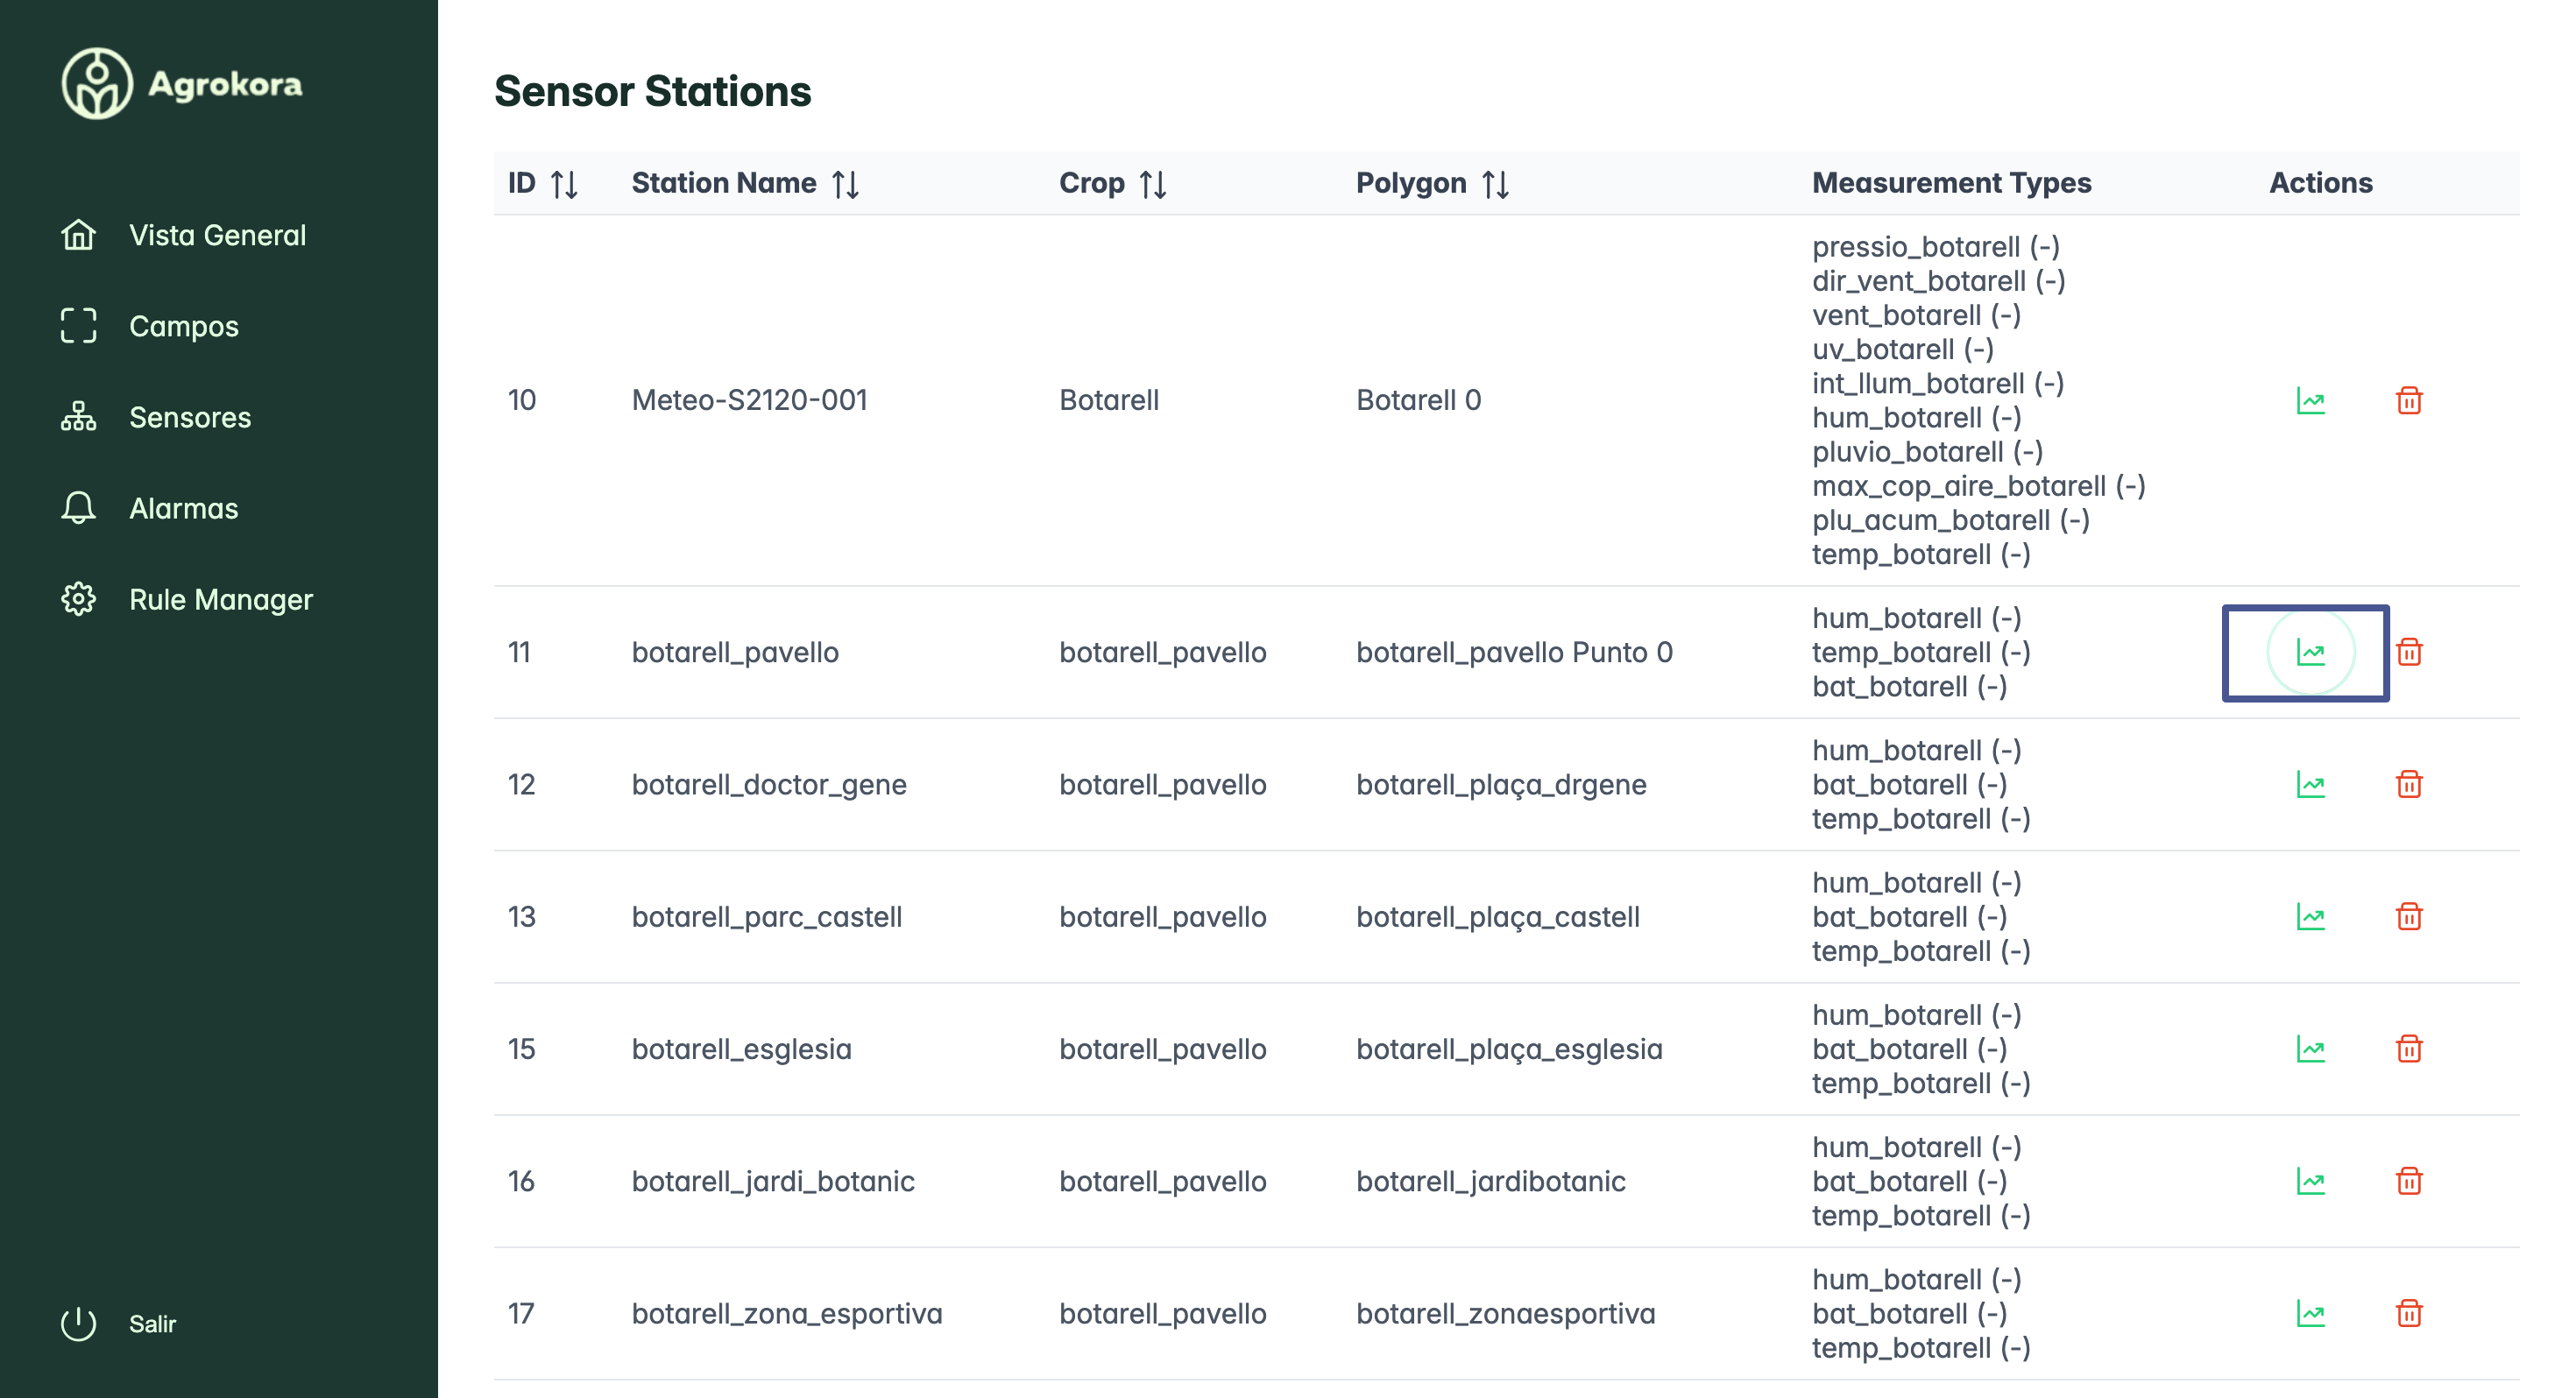
  • monitor each sensor station, anywhere Sensor Data Pn
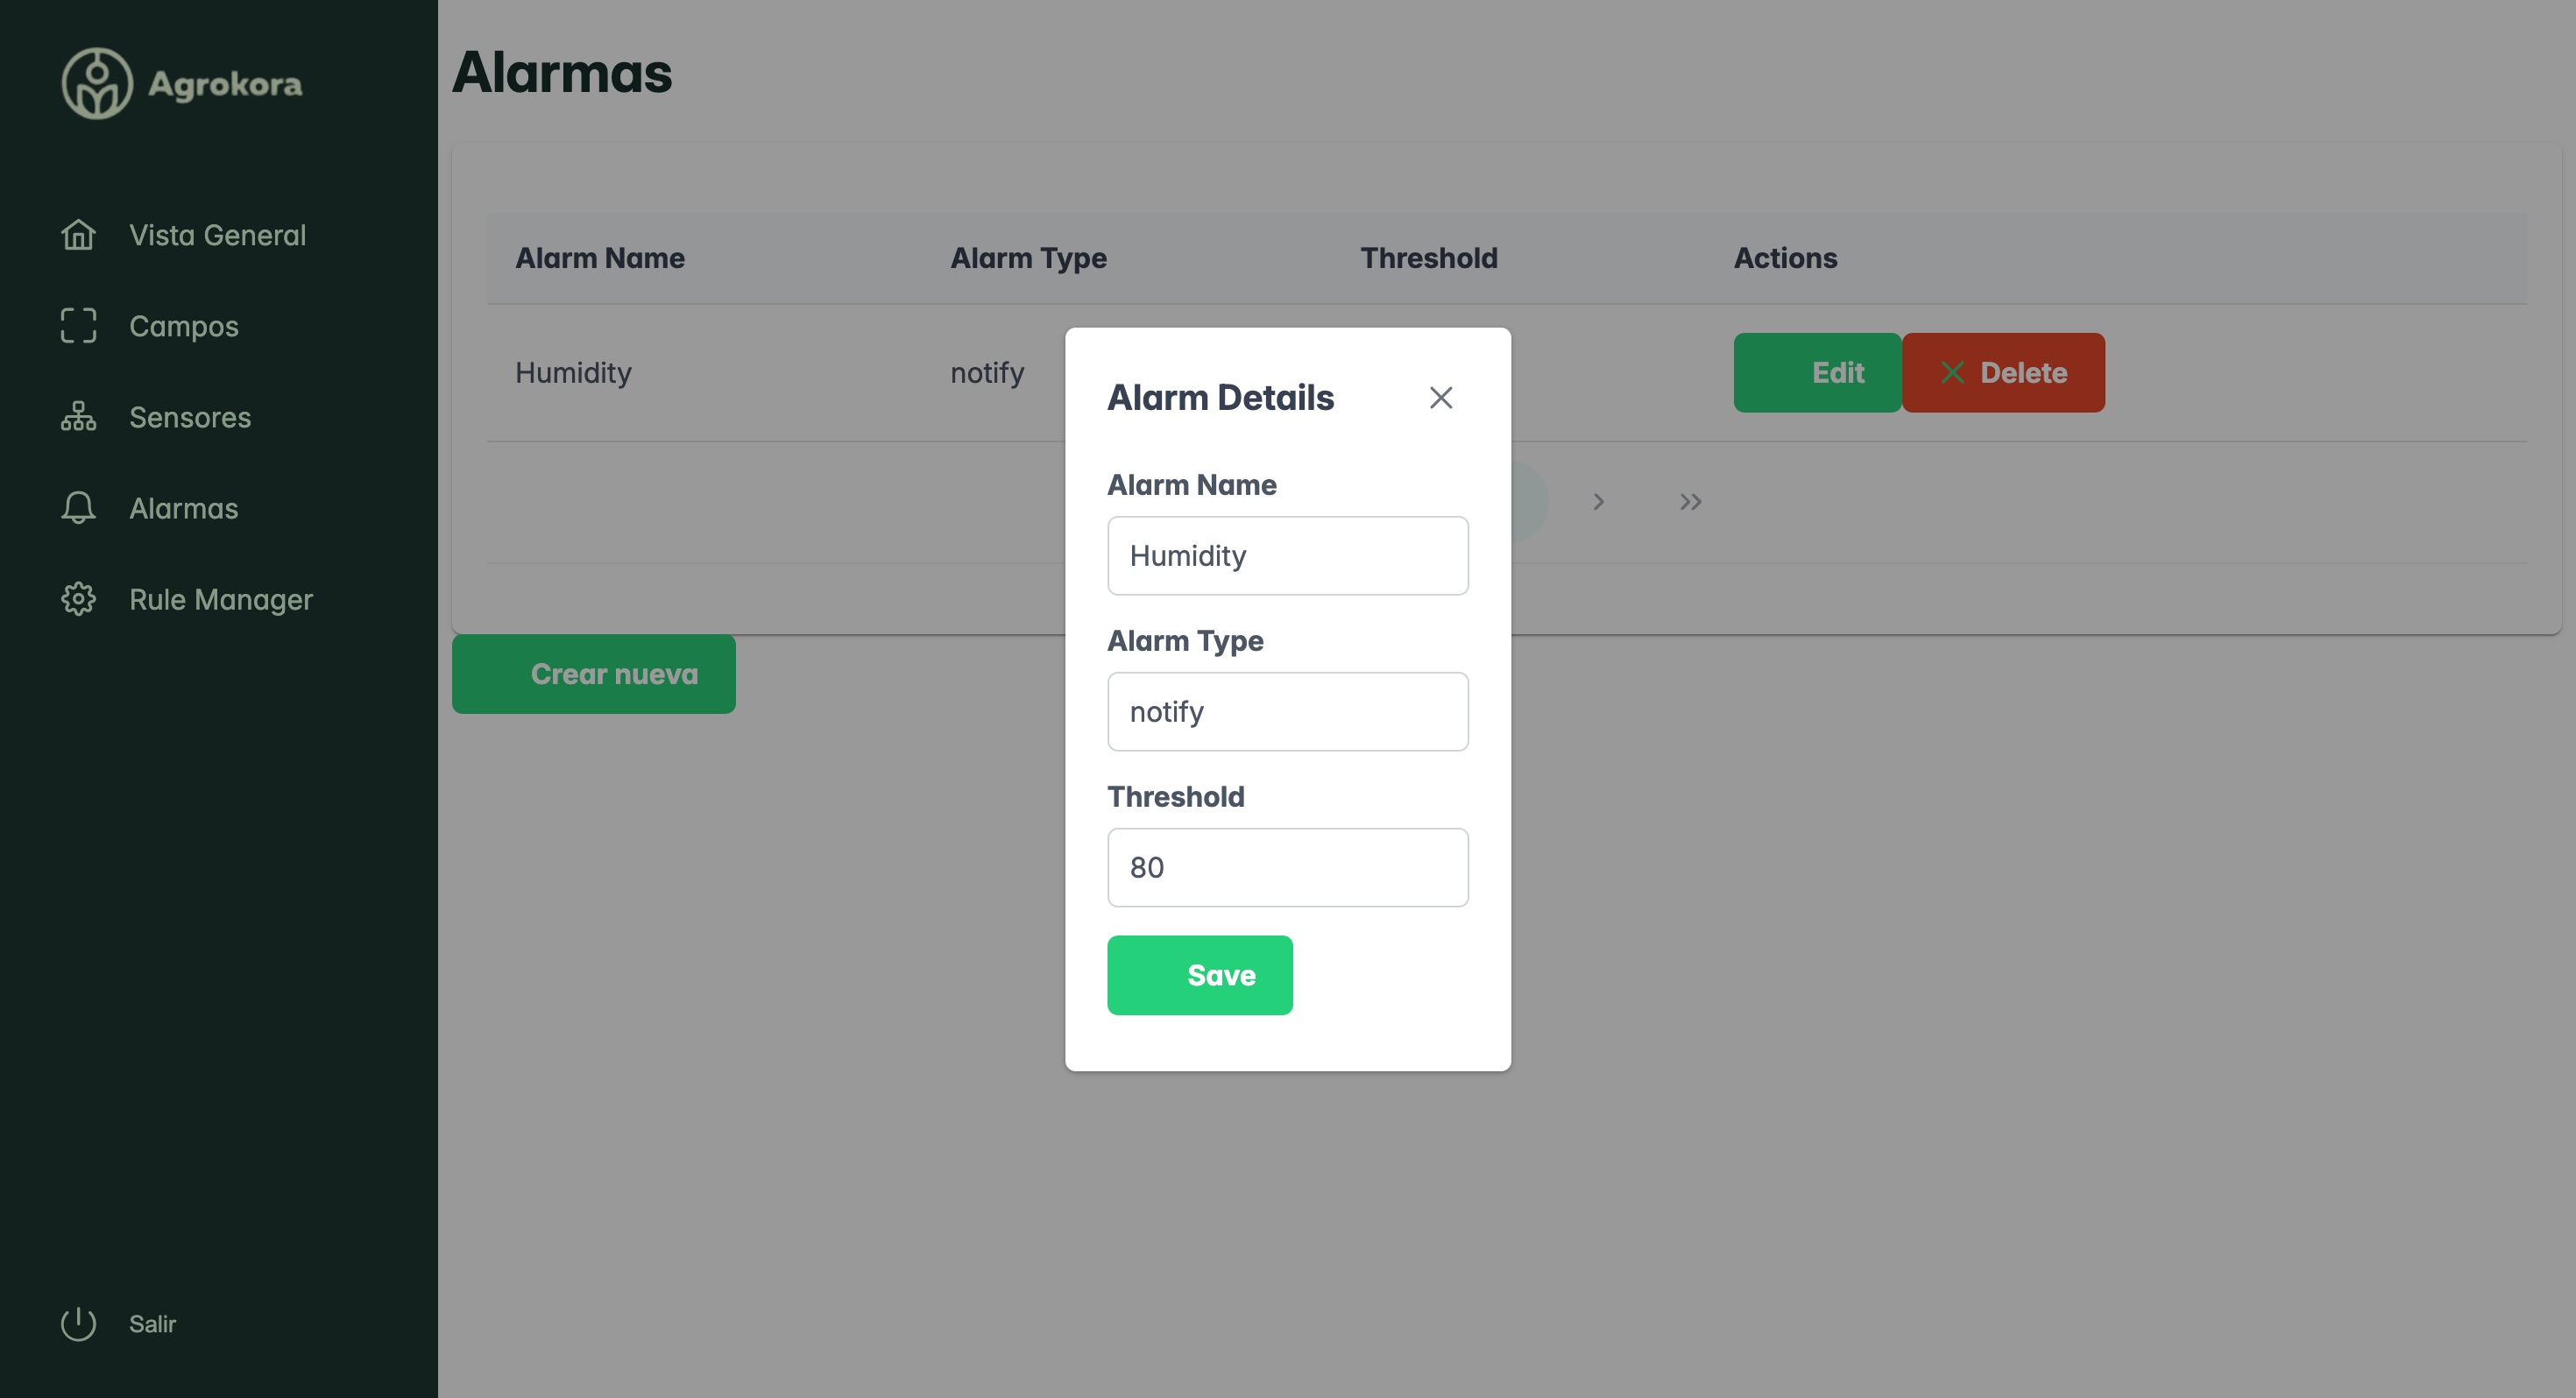
  • set alerts when specific measurements exceed a specific threshold
Alarms Pn