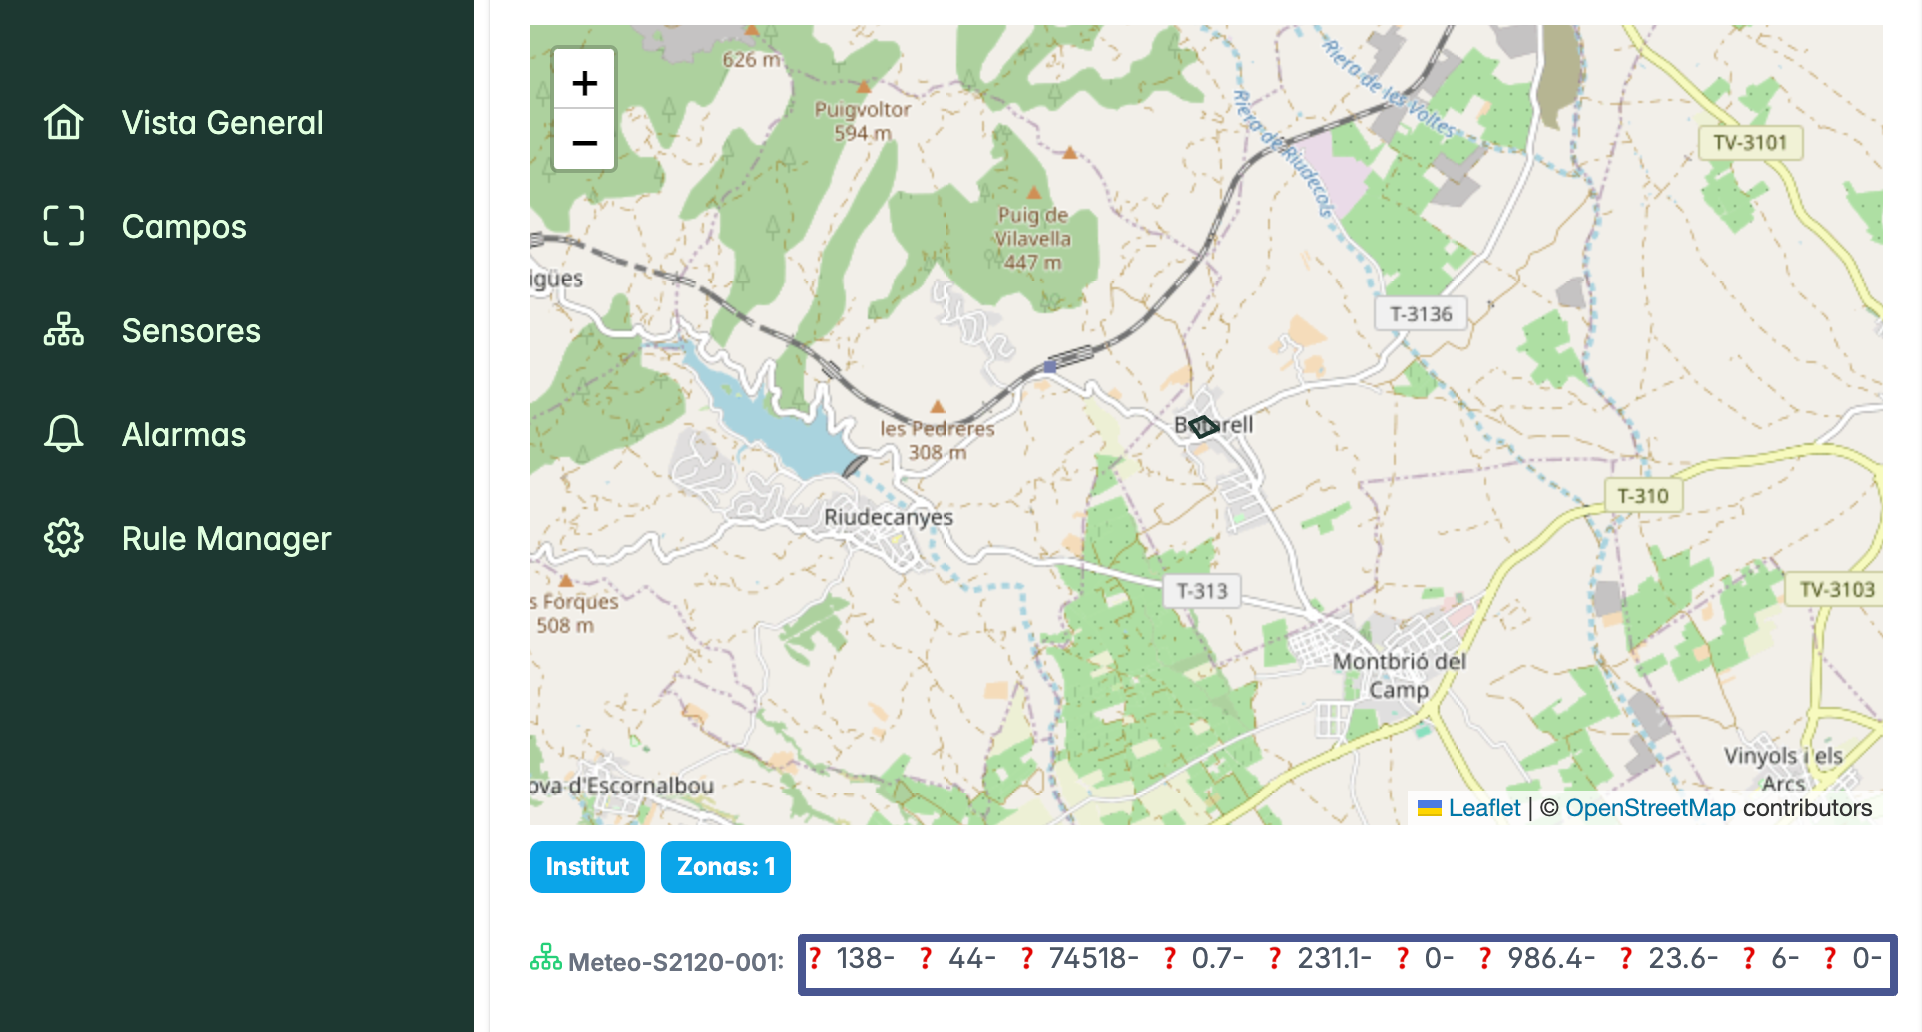
View data summary in your app
When you switch on the sensor station, the sensors will immediately start sending data. You will find the summary of the most recent data on the Overview page. The overview page offers a summary of the latest sensor data as well as the latest minimum and maximum values. You can also use the map to zoom in to see where the sensor station is located.Note that the amount of data on the overview page depends on the type and number of sensors you have.